Hi, my name is Namiko, and I am in charge of testing for WBS Gantt-Chart for JIRA.
Whenever Ricksoft releases a new version of the application, we carry out a performance measurement test. In this case, the test consisted of 3,641 tasks, with five levels structured hierarchically, starting from “Project” as shown:
In this article, we share the test results for the development version of Version 9.0, due for release shortly.
Performance test conditions
The test conditions were as follows:
| JIRA version | Chrome version | CPU | Number of Tasks in Project |
|---|---|---|---|
| 6.4.0 | 56.0.2924.87 (64-bit) | Core i7-6600U CPU @ 2.60GHz 2.81 GHz | 3,641 |
Each “task” represents an “issue” in JIRA. For each task, we tested all of the app’s custom field types, with three test scenarios as follows:
- Collapse all tasks when they are in expanded view;
- Expand all tasks when they are collapsed;
- Set tasks to expand by default each time they are brought in from JIRA.
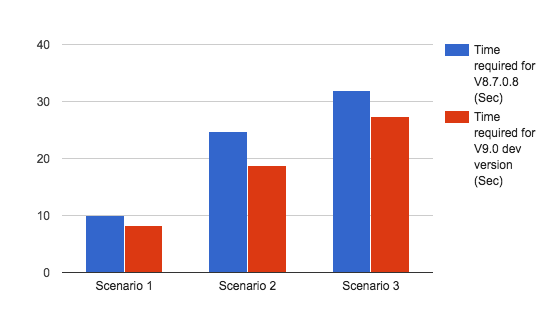
Test results: Up to 25% faster with Version 9.0
| Time required for V8.7.0.8 (Sec) | Time required for V9.0 dev version (Sec) | Improvement in time required (%) | ||
|---|---|---|---|---|
| Scenario 1 | 1st | 12 | 9 | |
| 2nd | 9 | 8 | ||
| 3rd | 9 | 8 | ||
| Average | 10.0 | 8.3 | +17.0 | |
| Scenario 2 | 1st | 25 | 19 | |
| 2nd | 24 | 19 | ||
| 3rd | 25 | 18 | ||
| Average | 24.7 | 18.7 | +24.3 | |
| Scenario 3 | 1st | 32 | 30 | |
| 2nd | 32 | 26 | ||
| 3rd | 32 | 26 | ||
| Average | 32.0 | 27.3 | +14.7 |
For each scenario, the development version was faster than the current version (by approximately 15-25% on average). The screen capture below shows the measurement results from the second test for scenario 2. Server processing took 14.33 seconds.
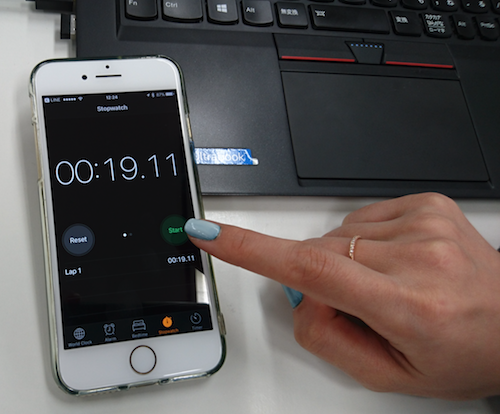
We used a stopwatch, as shown in the picture, to measure the total time required for rendering to complete (time taken combined with browser processing time). The measurement in this instance is 19 seconds.
Ideal for enterprise use
WBS Gantt-Chart for JIRA can handle anything from small projects with only a few issues to large-scale projects with thousands of issues. The ability to handle a high volume of issues is essential in an enterprise environment. This test shows that WBS Gantt-Chart for JIRA can deal with over 3,000 issues in JIRA error-free.
Use it with confidence for high volumes of issues in an enterprise environment. Try WBS Gantt-Chart for JIRA for free today.
#wbsganttchart


