Putting agile and Gantt charts in the same sentence can trigger eye rolls.
But stay with us.
Today’s Gantt chart is a lot different than its 19th-century predecessor. While still keeping the signature waterfall-like timeline, modern Gantt-based project management software is designed with agile capabilities.
Atlassian explicitly introduces the roadmap feature to Jira for long-term planning, which is derived from the core function of Gantt charts. So there is no reason to abandon Gantt charts from agile project management.
The components of a Gantt chart depict the basic framework for scaling agile at the enterprise level:
- Roadmap planning
- Progress tracking
- Dependency visualization
- Capacity management
Continue reading to learn about:
- What does it mean to scale agile?
- Steps to scaling agile with WBS Gantt-Chart for Jira
What Does it Mean to Scale Agile?
The foundation of agile aims to support continuous improvements in product delivery, specifically in software development. It enables businesses to speed up time to market while satisfying their customer expectations with a minimum viable product (MVP).
To achieve that, a typical agile team assembles the multiple roles required to accomplish a specific project. These cross-functional teams are called scrum, and are often sized between three to nine members.
A scrum team has the full competencies to complete the work with autonomy. Removing top-down guidance allows them to adapt to change quickly.
In large organizations with thousands of employees, you may have hundreds of scrum teams working in parallel. The challenge is to align everyone around the same goal to ensure organizational agility.
As stated in the agile manifesto, the principle “individuals and interactions over processes and tools” works for team-level scrum. When the team scales, the lack of coordination and end-to-end visibility of work may lead to fragmented value delivery.
That’s where agile starts to break.
Scaling agile essentially means scaling organizational agility, as illustrated below:
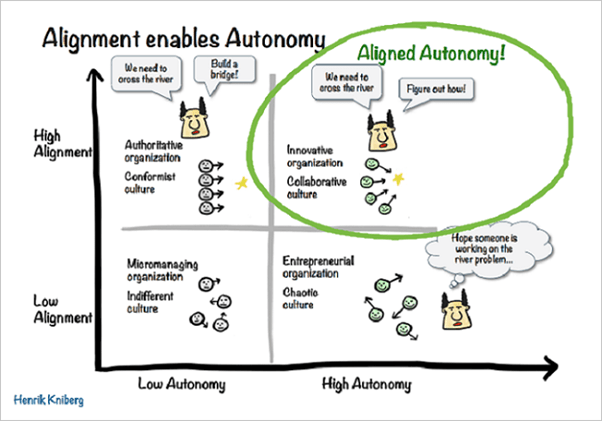
Without alignment, agile teams end up working in a vacuum.
To solve this challenge, you can visualize the connection between teams on a project timeline. That way, everyone can see the bigger picture and collaborate more effectively.
While Jira offers best-in-class agile capabilities, it falls short when it comes to big-picture visualization.
This is where Gantt charts come in. Learn how to scale agile with Gantt charts in the following section.
Get started by installing WBS Gantt-Chart for Jira from the Atlassian Marketplace. You can take advantage of the 30-day free trial to explore the capabilities described below.
Read more: How to Create a Gantt Chart in Jira
5 Steps to Scaling Agile with Gantt Charts in Jira
Here’s a scenario: Manage a chatbot development project that involves the product and marketing teams. The goal is to facilitate cross-functional planning and accomplish high-level deliverables.
We will go ahead and create a new Chatbot project in Jira. Let’s go through our step-by-step guide to managing scrum teams at scale.
Step 1: Identify the epics and break them down
Having a shared backlog is the most important criteria for managing agile at scale. It also allows teams to synchronize their sprints.
Epics represent team-level objectives. Each team can then break the epic down into bite-sized tasks that can be assigned to an individual member.
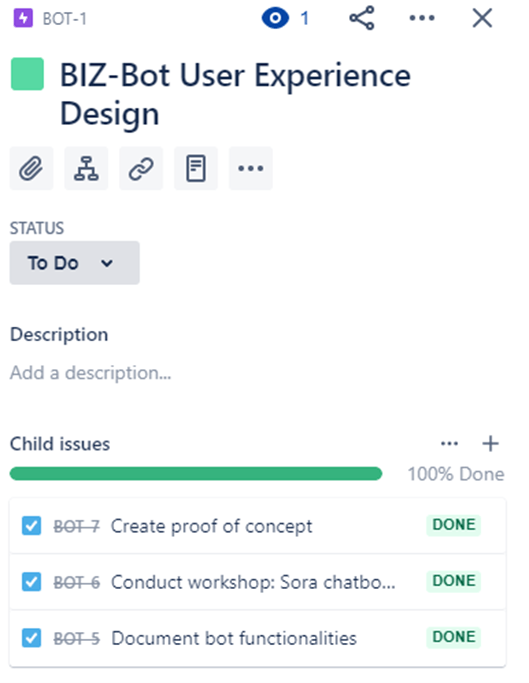
The downside of Jira is that it doesn’t show the hierarchical order of tasks, other than by nestling them under Child issues.
By translating these tasks into a Gantt chart, you will have an accurate overview of the tasks in a work breakdown structure:
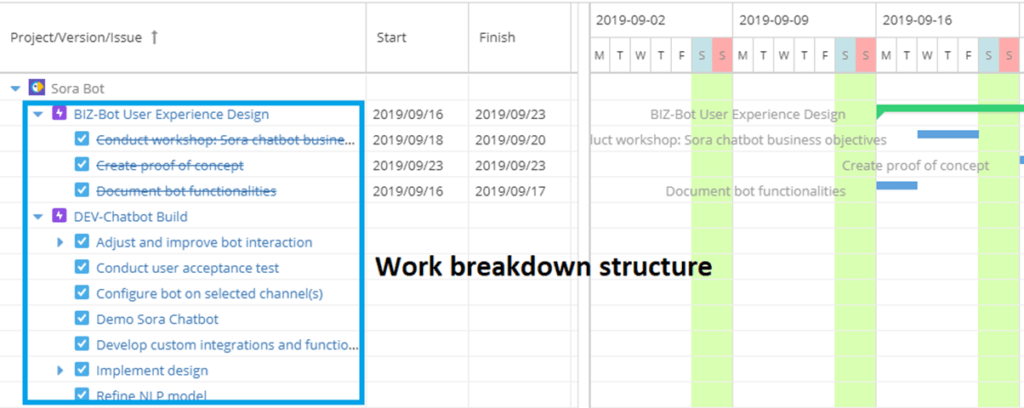
The work breakdown structure gives clarity to every issue that is otherwise buried in the endless Jira backlog. This is one of the key differentiating features since Jira scrum board doesn’t show issues at the sub-task level.
Unlike the rigid planning in traditional waterfall project models, modern Gantt software like WBS Gantt-Chart is fully integrated with Jira, so you can freely adjust your project plan and timeline, reprioritizing items from the backlog as the sprint progresses.
Step 2: Add dependencies
Next, identify the relationships between tasks by adding dependencies. This allows teams to determine the optimum workflow to avoid any potential roadblocks.
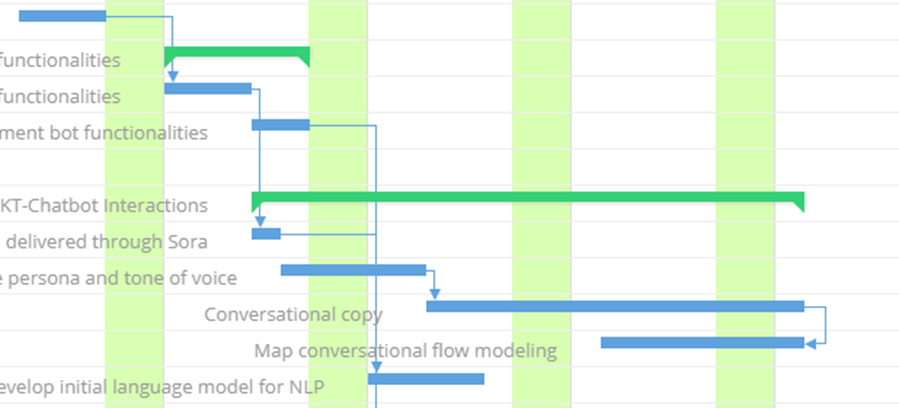
The linked tasks help teams stay on top of their schedule, so they can prioritize the tasks that are blocking other teams from moving forward.
Step 3: Scrum stand-up meetings
You are already familiar with daily stand-ups. But what about meetings between multiple scrum teams?
A common framework for an effective scrum-at-scale alignment is called Scrum of Scrums (SoS). In SoS, every scrum team runs its own daily stand-up, then designates a representative to join the SoS meeting, which usually happens at the end of every iteration.
Similar to a typical daily stand-up, each member will then share with the rest of the group what their team has accomplished, the goal for this coming sprint, and if they are facing any impediments.
With the big picture project view in Gantt chart, you can easily identify the critical path that directly impacts the project schedule.
Step 4: Manage capacity
With multiple teams working together, managing resources can be challenging. You need an effective way to determine the project scope and assign tasks based on your teams’ bandwidth.
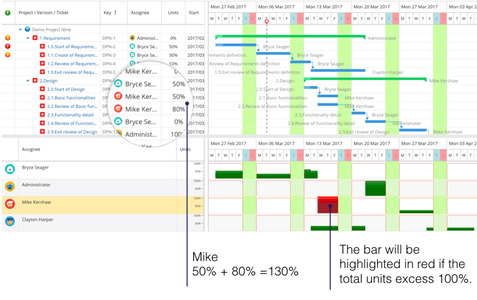
The Gantt chart app automatically triggers an alert if anyone is overcommitting. From here, you can adjust the team assignments to ensure productivity and efficiency.
Step 5: Communicate progress
Jira roadmap offers a convenient way to track the overall project progress. However, it doesn’t reflect the completion status of the product deliverables.
With the Gantt chart, you can create milestones to signal the major checkpoints of the project; for example, releasing the product demo.
Tracking project milestones helps teams stay informed of important deliverables.
Watch this video to understand more about milestone tracking.
As internal team members can track their progress towards the project deadline, you can also export the project plan from WBS Gantt-Chart for Jira to Excel to communicate with external shareholders.
Scaling agile takes an eye towards continuous improvement to perfect your engine. There are various scaled agile frameworks that can help you gear up.
We hope that you find this blog post helpful. Share with us your own experiences in scaling agile in the comments below!