Agile vs Gantt Chart
Two opposing forces, each with its own set of principles (and staunch supporters). While the former is renowned for its flexibility that welcomes changes, the latter made its mark through thorough planning that controls changes.
Do you think agile can work together with Gantt charts?
We do.
Continue reading this blog post to learn about the six powerful ways agile teams can use Gantt charts to improve agile value delivery.
Can Agile Teams Use Gantt Charts?
Back to our question earlier: Can agile work with Gantt charts? In the world of agile where responding to changes can result in gaining a competitive edge, Gantt charts are (inaccurately) considered inefficient because they’re too rigid to accommodate changes.
But here’s the thing: The big-picture planning that Gantt charts offer perfectly complements the flexibility of agile development. Together, you and your agile teams can carefully balance iterative and incremental agile development that still follows an overarching project plan.
6 Ways Agile Teams Can Use Gantt Charts
Now, here are the six ways agile teams from various industries can use Gantt charts when managing projects to improve agile value delivery.
1: Gantt Charts Minimize Agile Scope Creep
There’s a fine line between being agile and being ad-hoc. With careful planning (AKA backlog grooming and sprint planning), sudden tasks should be minimized. However, that’s not always the case. We’re sure you’ve suffered from agile scope creep before. It’s where new and unplanned items are added or appear in the middle of the sprint, causing teams to rush to deliver them.
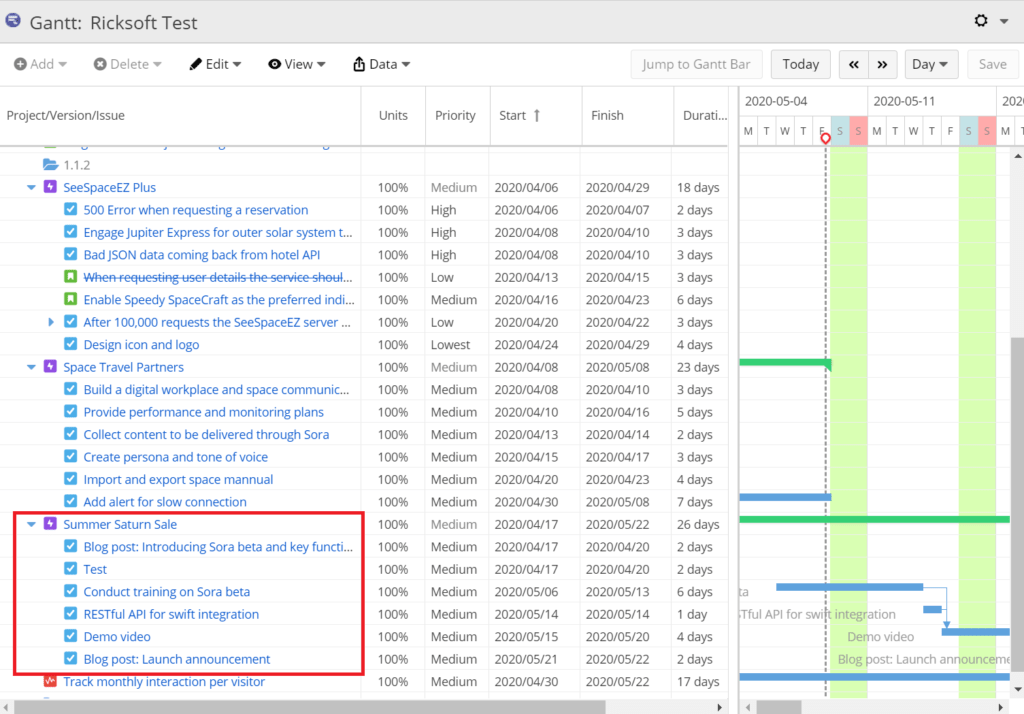
Agile Gantt charts help you to minimize agile scope creep through a Work Breakdown Structure (WBS)—a hierarchical tree structure that breaks down projects into smaller, manageable tasks. Once a project has been broken down into its smallest unit of work, you can then stage it for a sprint. This way, there won’t be sudden blockers popping up.
You can also use the Gantt chart and WBS as a Statement of Work (SoW) so that key stakeholders will know exactly all the tasks involved in a project as well as the estimated timeline and resources (e.g., staff) required.
2: Gantt Charts Visualize Agile Project Dependencies
Usually, tasks are developed based on priority in each sprint. That said, how are you to know which task within a sprint should be done first? If Jira is your agile project management platform, you can achieve that using issue linking. However, it can be complicated to manage tons of linked issues.
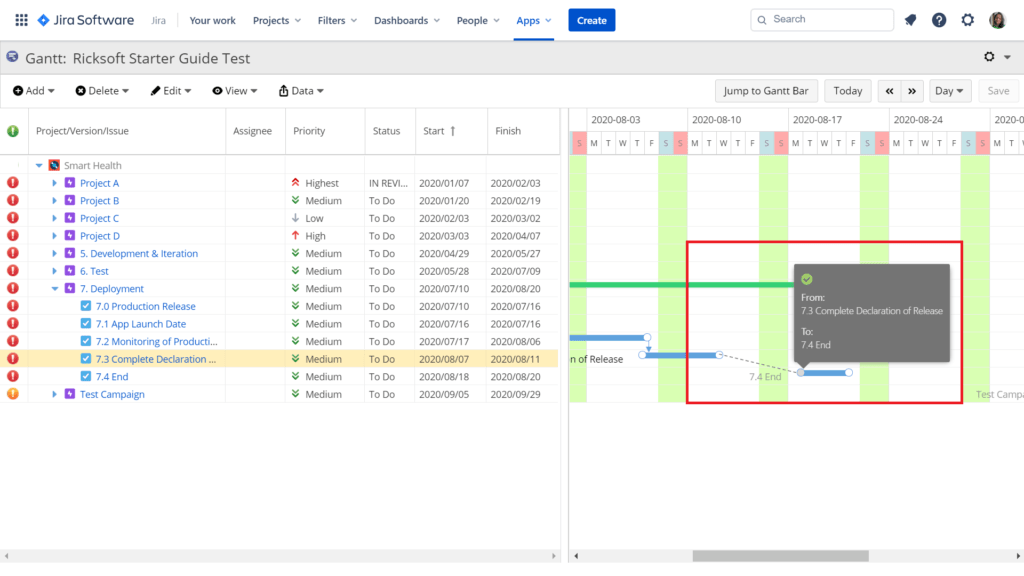
Fortunately, agile Gantt charts come equipped with task-dependency visualization, where you can clearly see how tasks are related to one another in a logical timeline sequence. With the right Jira Gantt chart app, you can instantly map Jira issues to the Gantt chart and add dependencies between them for seamless project progress.
3: Gantt Charts Support Agile Resource Planning
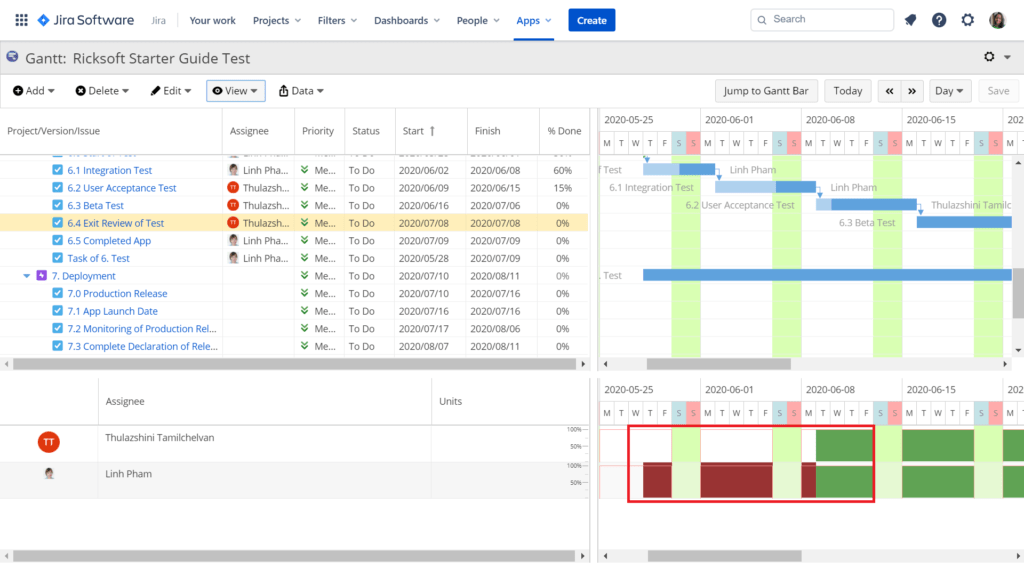
The beauty of agile project management is its resource planning. In Jira, you can use various estimation factors, like story points to determine your team’s workload. You can still take this one step further by using the resource allocation feature in Gantt charts.
With a Jira Gantt chart plugin like Ricksoft’s WBS Gantt-Chart for Jira, use its resource management feature to visualize the workload of each team member. The tool will notify you if you overestimate a team member’s capacity so that you can redistribute work efficiently.
4: Gantt Chart Milestones Guide Agile Teams to Deliver on Time
The thing with agile project management software like Jira is that it doesn’t capture business milestones like a new app release on an agile roadmap. Some companies may work around this issue by using epics in Jira as milestones and assigning them to respective releases. Alternatively, sprint deliverables may also be considered milestones.
But this can be tricky to navigate when there’s enterprise-wide collaboration, where one team’s priority may block another team’s progress. The key is to unite various agile teams throughout the project lifecycle to ensure continuous progress.
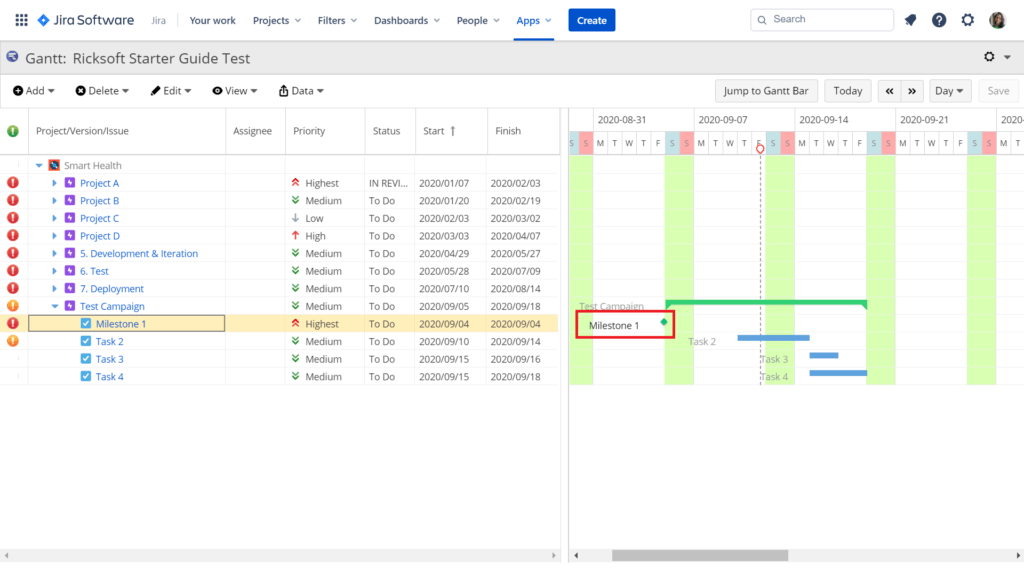
Something that the milestone feature in agile Gantt charts can achieve. By visualizing milestones on a Gantt chart, you can coordinate tasks between different teams so that everyone can do their part to ensure timely value delivery.
5: Gantt Charts Enhance Agile and Non-Agile Collaboration
Not everyone in a company uses the exact same project management methodology and platform to do work. For example, you may have your agile development team working in Jira while the non-agile accounting team prefers Excel. Not unifying them can result in silos and reduced productivity.
With the help of Gantt charts’ visualization capability, you can unite agile and non-agile teams. With an easy-to-understand interface, everyone can know the task breakdown of a large project, how the tasks are related to one another, and the progress of each task.
6: Gantt Charts Easily Communicate Agile Project Progress
“Velocity, burndown, lead time, net promoter score…”
You probably understand and use these agile metrics to measure the productivity level of your team. However, your upper management may not be well-versed in agile speaking. In fact, upper management folks are more concerned with the overall project progress than individual sprints.
So, tackle this situation by using both. Reserve the agile metrics to measure the progress of your team and use Gantt charts to visualize project progress. You can also use the latter (especially the WBS) to manage stakeholders’ expectations.
Making Your Agile Team Better with Gantt Charts
The final verdict is that agile Gantt charts can do wonders for your agile teams, from big-picture planning to celebrating milestones once achieved.
But to make sure that your Gantt chart is truly aligned with the fast-paced development of your agile projects and teams, choose a tool that can be easily incorporated into your project management platform. For example, if your agile teams thrive in Jira, choose a third-party Gantt chart app like WBS Gantt-Chart for Jira for better agile project management. Alternatively, if you’re in search of a Gantt-Chart solution for Confluence, Gantt Chart Planner for Confluence would be an excellent option.
Check out our Complete Guide to Using Gantt Charts in Agile Project Management to learn how to power up your agile project management using Gantt Charts.