There’s an infamous saying that goes: “If you fail to plan, you plan to fail.” Indeed, a project is only as good as the planning you put into it.
Besides core elements like objectives and scope, the basic component that makes a project plan a blueprint for success is a milestone. You can group related tasks under a specific milestone to define the critical path of the project and identify potential bottlenecks along the way. Milestones enable your team to see important dates when their collective tasks are expected to be done, and how those tasks lead to the desired project outcomes.
Unlike tasks, milestones don’t have a fixed duration. Think of them as real-time progress reports. You can also use milestones to indicate go- or no-go decisions, such as “Client Review Approval” or “Website Design Done.”
To project the relation between tasks and milestones, PMPs use Gantt charts as a preferred planning tool. In this blog post, we will show you exactly how to manage milestones and deliver your project on-time with an integrated Gantt chart app right within Jira.
How to Identify Project Milestones
Our lives are filled with milestones, such as graduation or getting our first job. Likewise, in project management, milestones identify important events along the project timeline. They follow a sequential order building up to the project’s completion.
We intuitively mention milestones instead of tasks when reporting on a project because they describe the “what” (processes), rather than the “how” (tasks). This makes it easier to communicate with different stakeholders, who may not be familiar with the nitty-gritty details of the project. Creating milestones also helps to align multiple teams around the project roadmap. Take, for example, a website redesign project. The typical milestones may include:
- Wireframe development
- Design review
- User acceptance testing
- Final review
- Launch
Imagine a scenario where the UI/UX designer takes longer than expected to develop the sitemap as part of the wireframe creation. The project manager would know immediately that the sitemap issue would delay the development team’s work. He can then adjust the timeline for the second milestone or assign a new team member to help get the prototyping phase moving along.
The principle when creating milestones is to keep them relevant and straightforward for tracking. The goal is to break off chunks of a project into smaller timeframes, which will help team members and stakeholders manage their expectations at any point of the project.
Creating Milestones with Gantt Charts
As far as planning is concerned, project management software like Jira doesn’t capture milestones on an agile roadmap. Some organizations work around this problem by using epics in Jira as milestones and assigning them to respective releases.
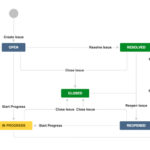
But problems arise when there are multiple issues associated with a single milestone. To report the current state of the project, you’d still need to drill down to all the issues rolling up to that epic. Also, you can’t trigger a go- or no-go decision with an epic unless you create a custom workflow in Jira.
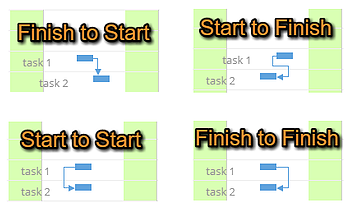
With WBS Gantt-Chart for Jira, you can enable the desired sign-off points by adding the linked issues to a milestone, for example, “finish-to-start.” This means that teams can only kickstart the next phase once the current phase is marked completed by the product owner.
When you have more than one team working together, chances are there will be dependencies. We designed the WBS Gantt-Chart app to provide a complete overview of how milestones link to one another.
WBS stands for Work Breakdown Structure, a chart that displays a hierarchical structure of tasks and milestones. You can choose to expand or collapse the task list to view only the timeline of your milestones. To add dependencies, simply drag and drop the connector points between them. See the sample below:
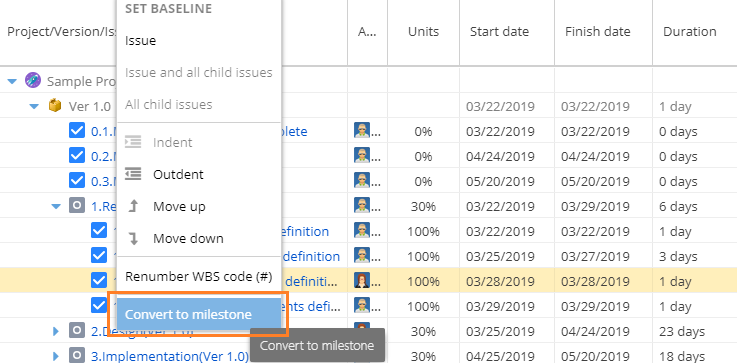
Notice that the duration for a milestone is “0 days,” and it is presented as a small diamond shape on the targeted completion date. Once you have imported a Jira project into the WBS Gantt-Chart, you can choose any story to convert it into a milestone from the contextual menu.
Read more: How to Create a Gantt Chart in Jira
Crush Your Project Milestones with Gantt Chart Integration for Jira
The next important step is to monitor your project milestones. Now, you need to pay attention to the pace in which your team is moving towards a milestone. Here are a few questions that help you forecast the outcomes:
- Is there a point that’s no longer valid?
- Will any of the teams complete a milestone ahead of time?
- Did you miss any milestones that should be part of the project plan?
In essence, the act of milestone planning follows Newton’s law of motion. For the project to move forward at a decent pace, you can either add forces or reduce the friction in your project roadmap.
If a particular milestone is being delayed, you need to adjust the resource allocation from another strand of the project so that teams won’t lose momentum. Likewise, if all your team members are overbooked, you know it’s necessary to remove less critical tasks associated with that milestone.
For instance, in our previous example, say the graphic designer has already submitted the visual assets, yet the website content is not yet ready. The project manager would see if he can get the development rolling without the actual content (removing bottleneck), or assign additional staff to write the remaining pages (adding forces) to avoid project delay.
It’s important to regularly check up on the project milestones to ensure that no team member is under- or over-utilized. Big-picture project assessment on a Gantt chart helps you do exactly that. Last but not least, don’t forget to celebrate your milestone achievements! Experience project management at its finest with milestone planning, try WBS Gantt-Chart for Jira for free today!
BONUS: [Free eBook] The Project Manager’s Guide to Atlassian Apps


