Developed in Response to User Demand – The Background to WBS Gantt-Chart for JIRA
When we originally began selling JIRA Software (known as “JIRA”), many of our customers said, “This is great, but can we use Gantt charts with this?” JIRA’s agile interface was great, but it did not give project managers a top-down view of the whole project in waterfall format. Here at Ricksoft, we were keen to look into this further, but our resources at the time were limited. Developing Gantt charts from scratch would have been difficult, so we had to put this on the backburner.
Some time later, we were formally approached by a customer to come up with a Gantt chart solution, and that gave us the opportunity to propose it for them. We only had two weeks in which to put our proposal together, so we were unsure how feasible this would be with such a tight deadline.
However, with the help of the excellent JavaScript Gantt chart drawing library, we were able to come up with a demo for JIRA in a short space of time.
And that is how “WBS Gantt-Chart for JIRA” came about.
Optimizing JIRA Software for project management
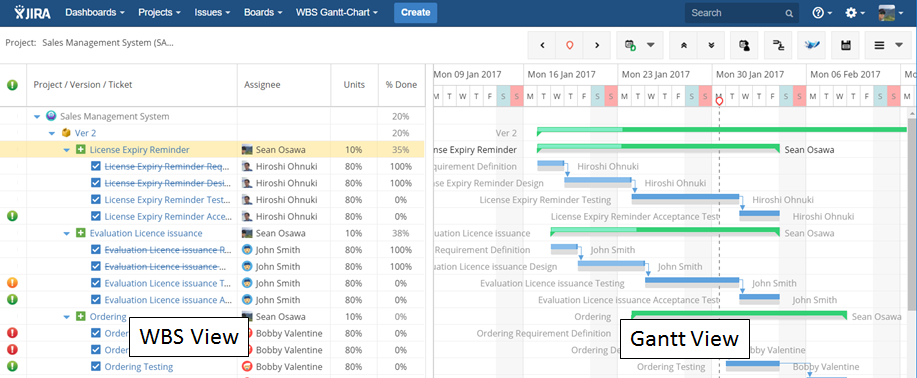
Now we will show you what WBS Gantt-Chart for JIRA can do. Its two primary functions are as follows:
- WBS view: Manage project tasks in a hierarchical framework;
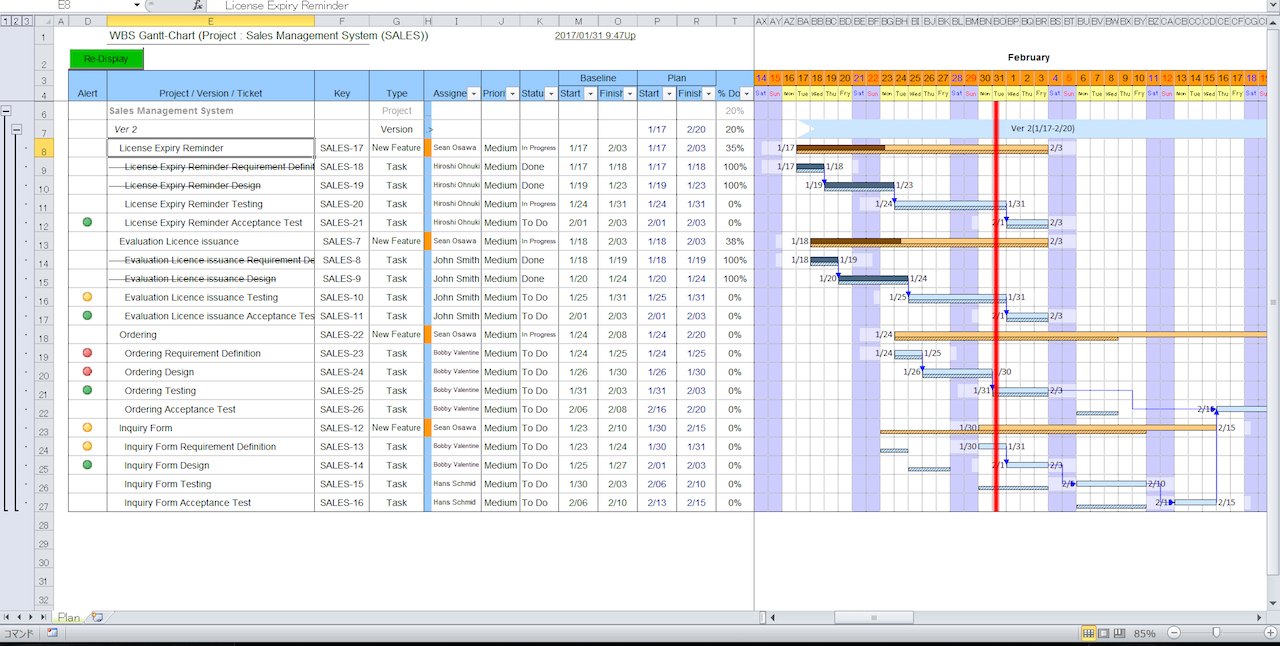
- Gantt chart view: Visually display task schedules, along with task dependencies.
These two features give the project manager a comprehensive overview of a project, which was not previously possible with JIRA.
The product enables you to carry out the following:
- Visually create, modify, and confirm a project schedule.
- Forecast project completion and check progress of the entire project, using features such as critical path and baselining.
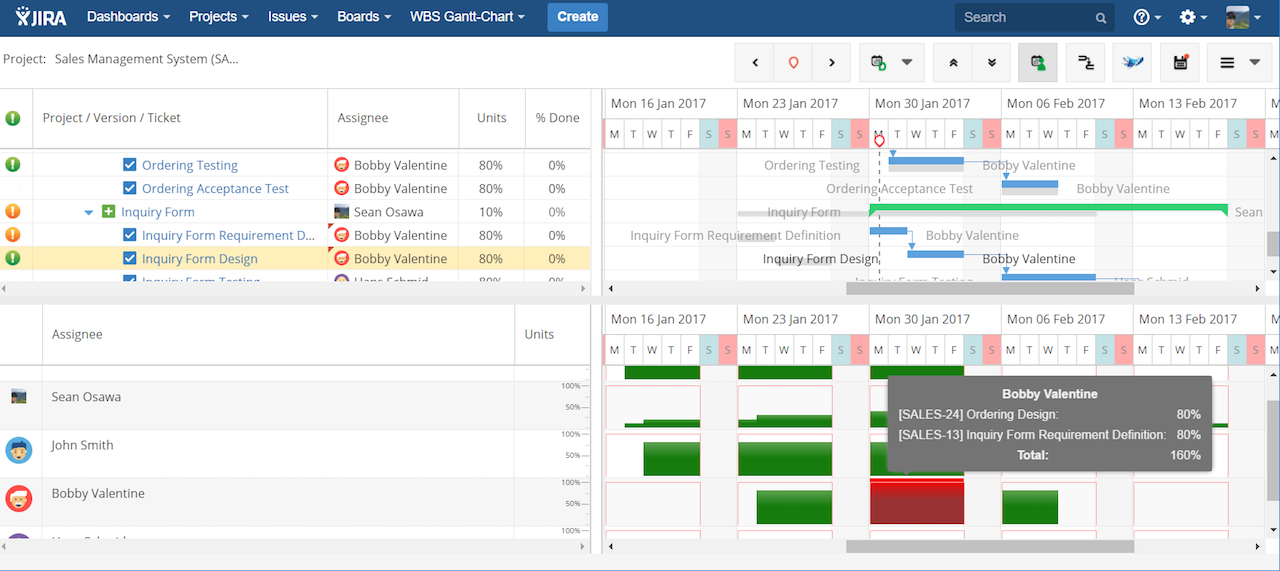
- Simulate member workload in schedule creation.
Next, we outline some of WBS Gantt-Chart for JIRA’s key features.
Implementing your project with WBS Gantt-Chart for JIRA
Starting a Project: Create the Schedule
At the beginning of the project, draw up your schedule on WBS Gantt Chart. Define the deliverables and break down the work into the tasks required to achieve this in WBS format.
Once you have created the tasks, you enter the number of days required, and the start and end-date for each. You can also link tasks in sequential relationships (‘predecessor’ and ‘successor’). This format is useful because the task schedule automatically updates as linked and related tasks change or are updated.
The WBS view is shown on the left side of the screen, with the Gantt chart view on the right.
Starting a Project: Check the Workload
Once you have a draft schedule, assign tasks to members and check their workload. You will need to modify the schedule if anyone’s workload exceeds 100%, as shown below:
Starting a Project: Create the Baseline
Keep modifying your schedule and updating member workloads in turn until you are happy with how the schedule looks. Once you have finalized this, set the “project baseline” to record the original plan as established at the beginning of the project.
If you prefer working in Excel, rather than creating your schedule in a web environment, you can use JIRA’s CSV import function. This enables you to create the data in Excel, save as a CSV file, and then import it.
During the Project
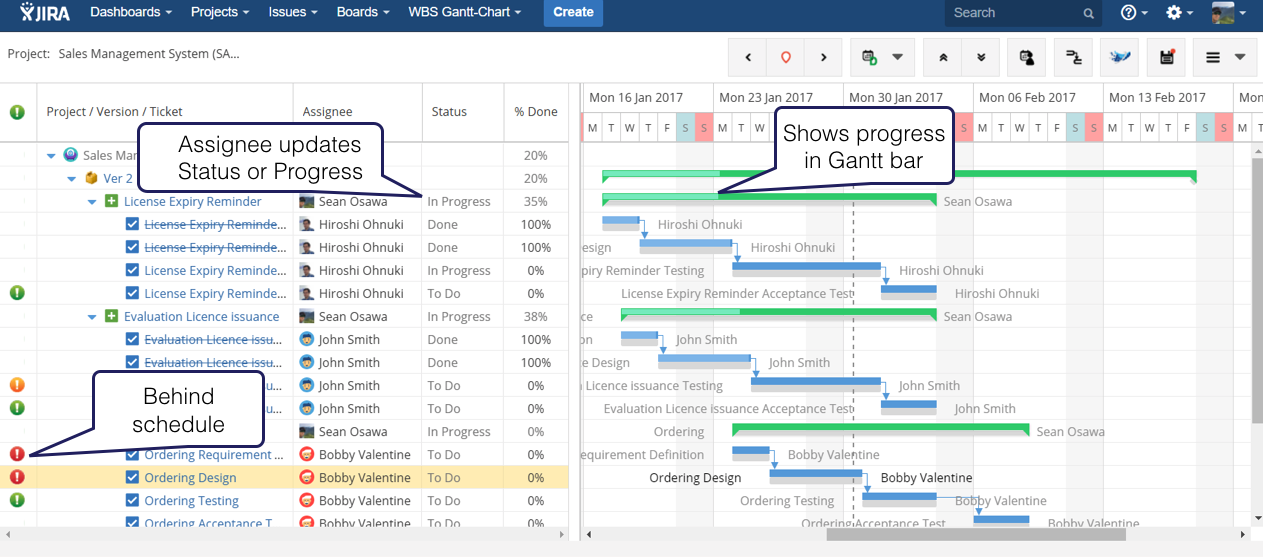
You might think it is a lot simpler just to set the project up in Excel. However, if you use JIRA, each member can update the status of the project, and work on issues themselves. The “issues management table” updates automatically, thereby reducing your own workload.
WBS Gantt Chart updates as and when any member updates the “status” or “progress” of the project, or a particular issue related to it. This allows project managers to focus on what they are supposed to do – identifying where work is behind schedule, for example, or updating the schedule and resources, as necessary.
Your project will probably not follow the original plan in its entirety. Throughout the project period, you will need to update the schedule and allocation of resources. The larger the project, the harder it becomes to keep documentation on project progress up to date. The difference between actual progress and documented progress could widen significantly. If that happens, it slows down your ability to respond when work falls behind schedule.
However, using WBS Gantt-Chart for JIRA and JIRA Software will enable you to seamlessly share progress with all project members, and respond quickly when necessary.
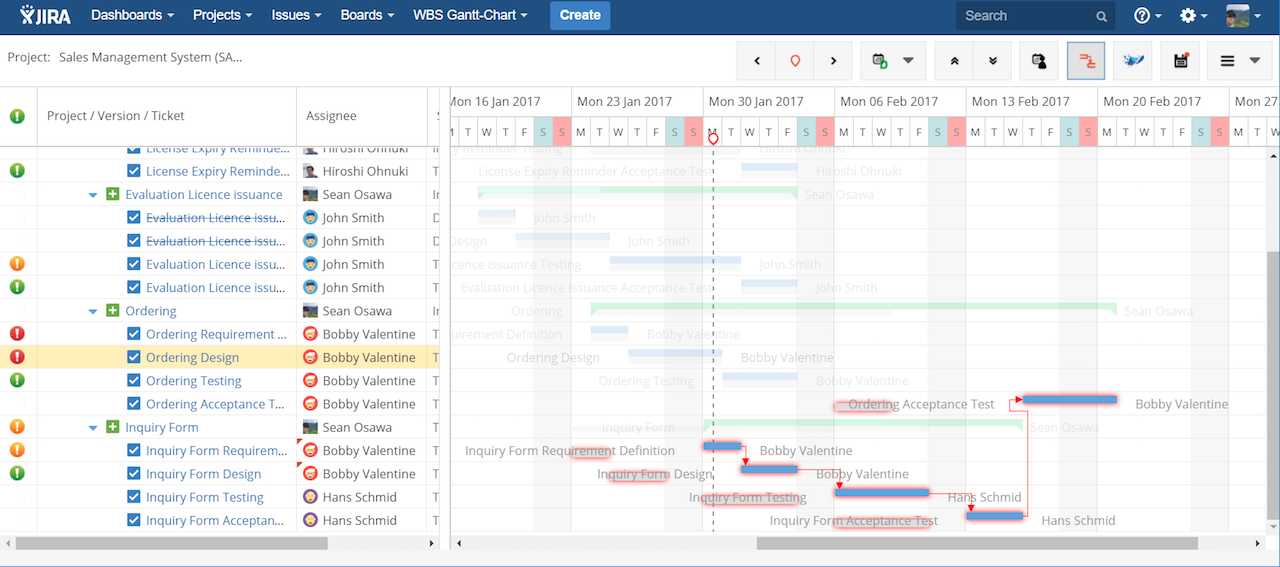
If you need to update the schedule, make sure you link predecessor tasks with successor tasks, just as you did when you created the original schedule. If you do this, then the task schedule automatically updates if you move a task. Using this feature enables you to assess the impact on the entire project of delays in specific tasks.
WBS Gantt-Chart for JIRA shows you the critical path of the project, so you can assess which tasks can be modified without delaying the entire schedule, and which tasks cannot.
Export to Excel
With WBS Gantt-Chart for JIRA, you can share the project schedule and progress against it with the rest of your team in a web interface. Moreover, if you need to report progress to someone outside the team, WBS Gantt-Chart for JIRA has a function which allows you to export the data to an Excel file. This is a time-saving feature which enables you to put together a progress report for external stakeholders in Excel quickly and effectively.
Try it for free
We have developed WBS Gantt-Chart for JIRA in response to user demand. Here at Ricksoft, we are always open to feedback and to new requests. You can try WBS Gantt-Chart for JIRA for free for 30 days, and take a look at its features. Please try it to help you manage your project more effectively!
#Ganttchart
