Project Management

Feb 20, 2019 • 5 min read
Topic
Author
In This Blog
Ready to enhance your project management in Jira with Gantt charts?
Learn how to get more out of your existing Jira projects with Ricksoft’s WBS Gantt-Chart for Jira in this guide.
But first, check out our Ultimate Guide to Jira Gantt Charts for an in-depth understanding of the key features of Gantt charts and their capabilities.
Now on to the real deal: let us show you step-by-step how to create a Gantt chart in Jira.
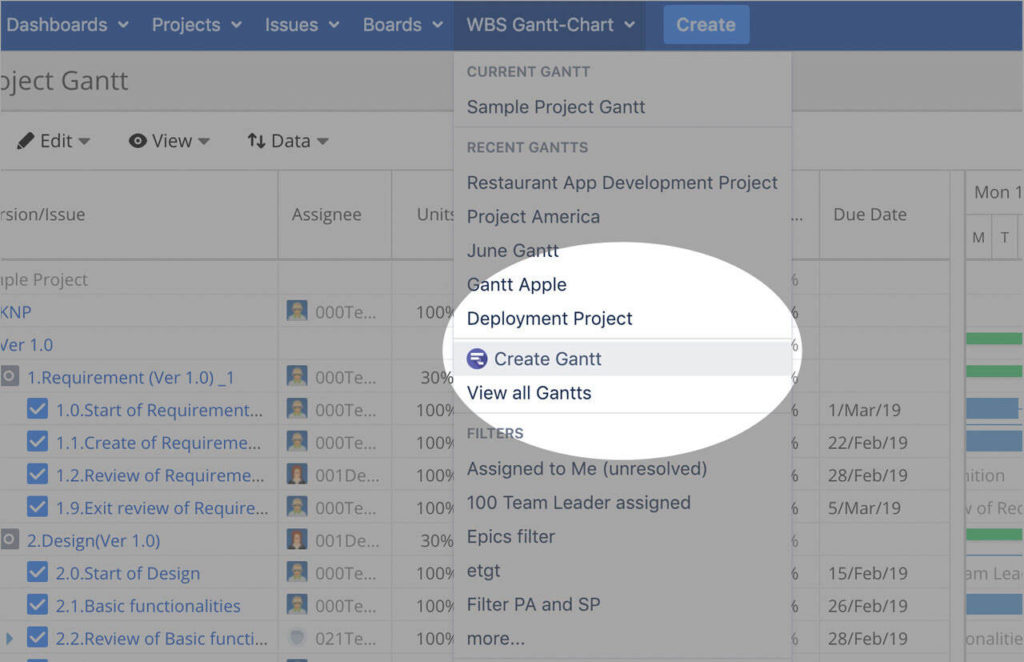
Once the WBS Gantt-Chart add-on is installed, you can find it on the top-level Apps menu.
From there, go to the app homepage, you’ll see two options to get started:
Project tab: Open your current project in Gantt chart view, this allows you to instantly visualize all issues in a project without having to configure a new Gantt
Gantt tab: Create a new Gantt from multiple projects and filter
When creating a new Gantt, you will be prompted to insert issues from Jira projects or saved filters. This means you can generate a new portfolio project view or narrow down the issues with the conditions predefined from a saved filter.
Now you’ve successfully created a Gantt chart with existing Jira issues. The Gantt chart view consists of a work breakdown structure (WBS) on the left and a timeline to display a big-picture view of your task’s duration and dependencies.
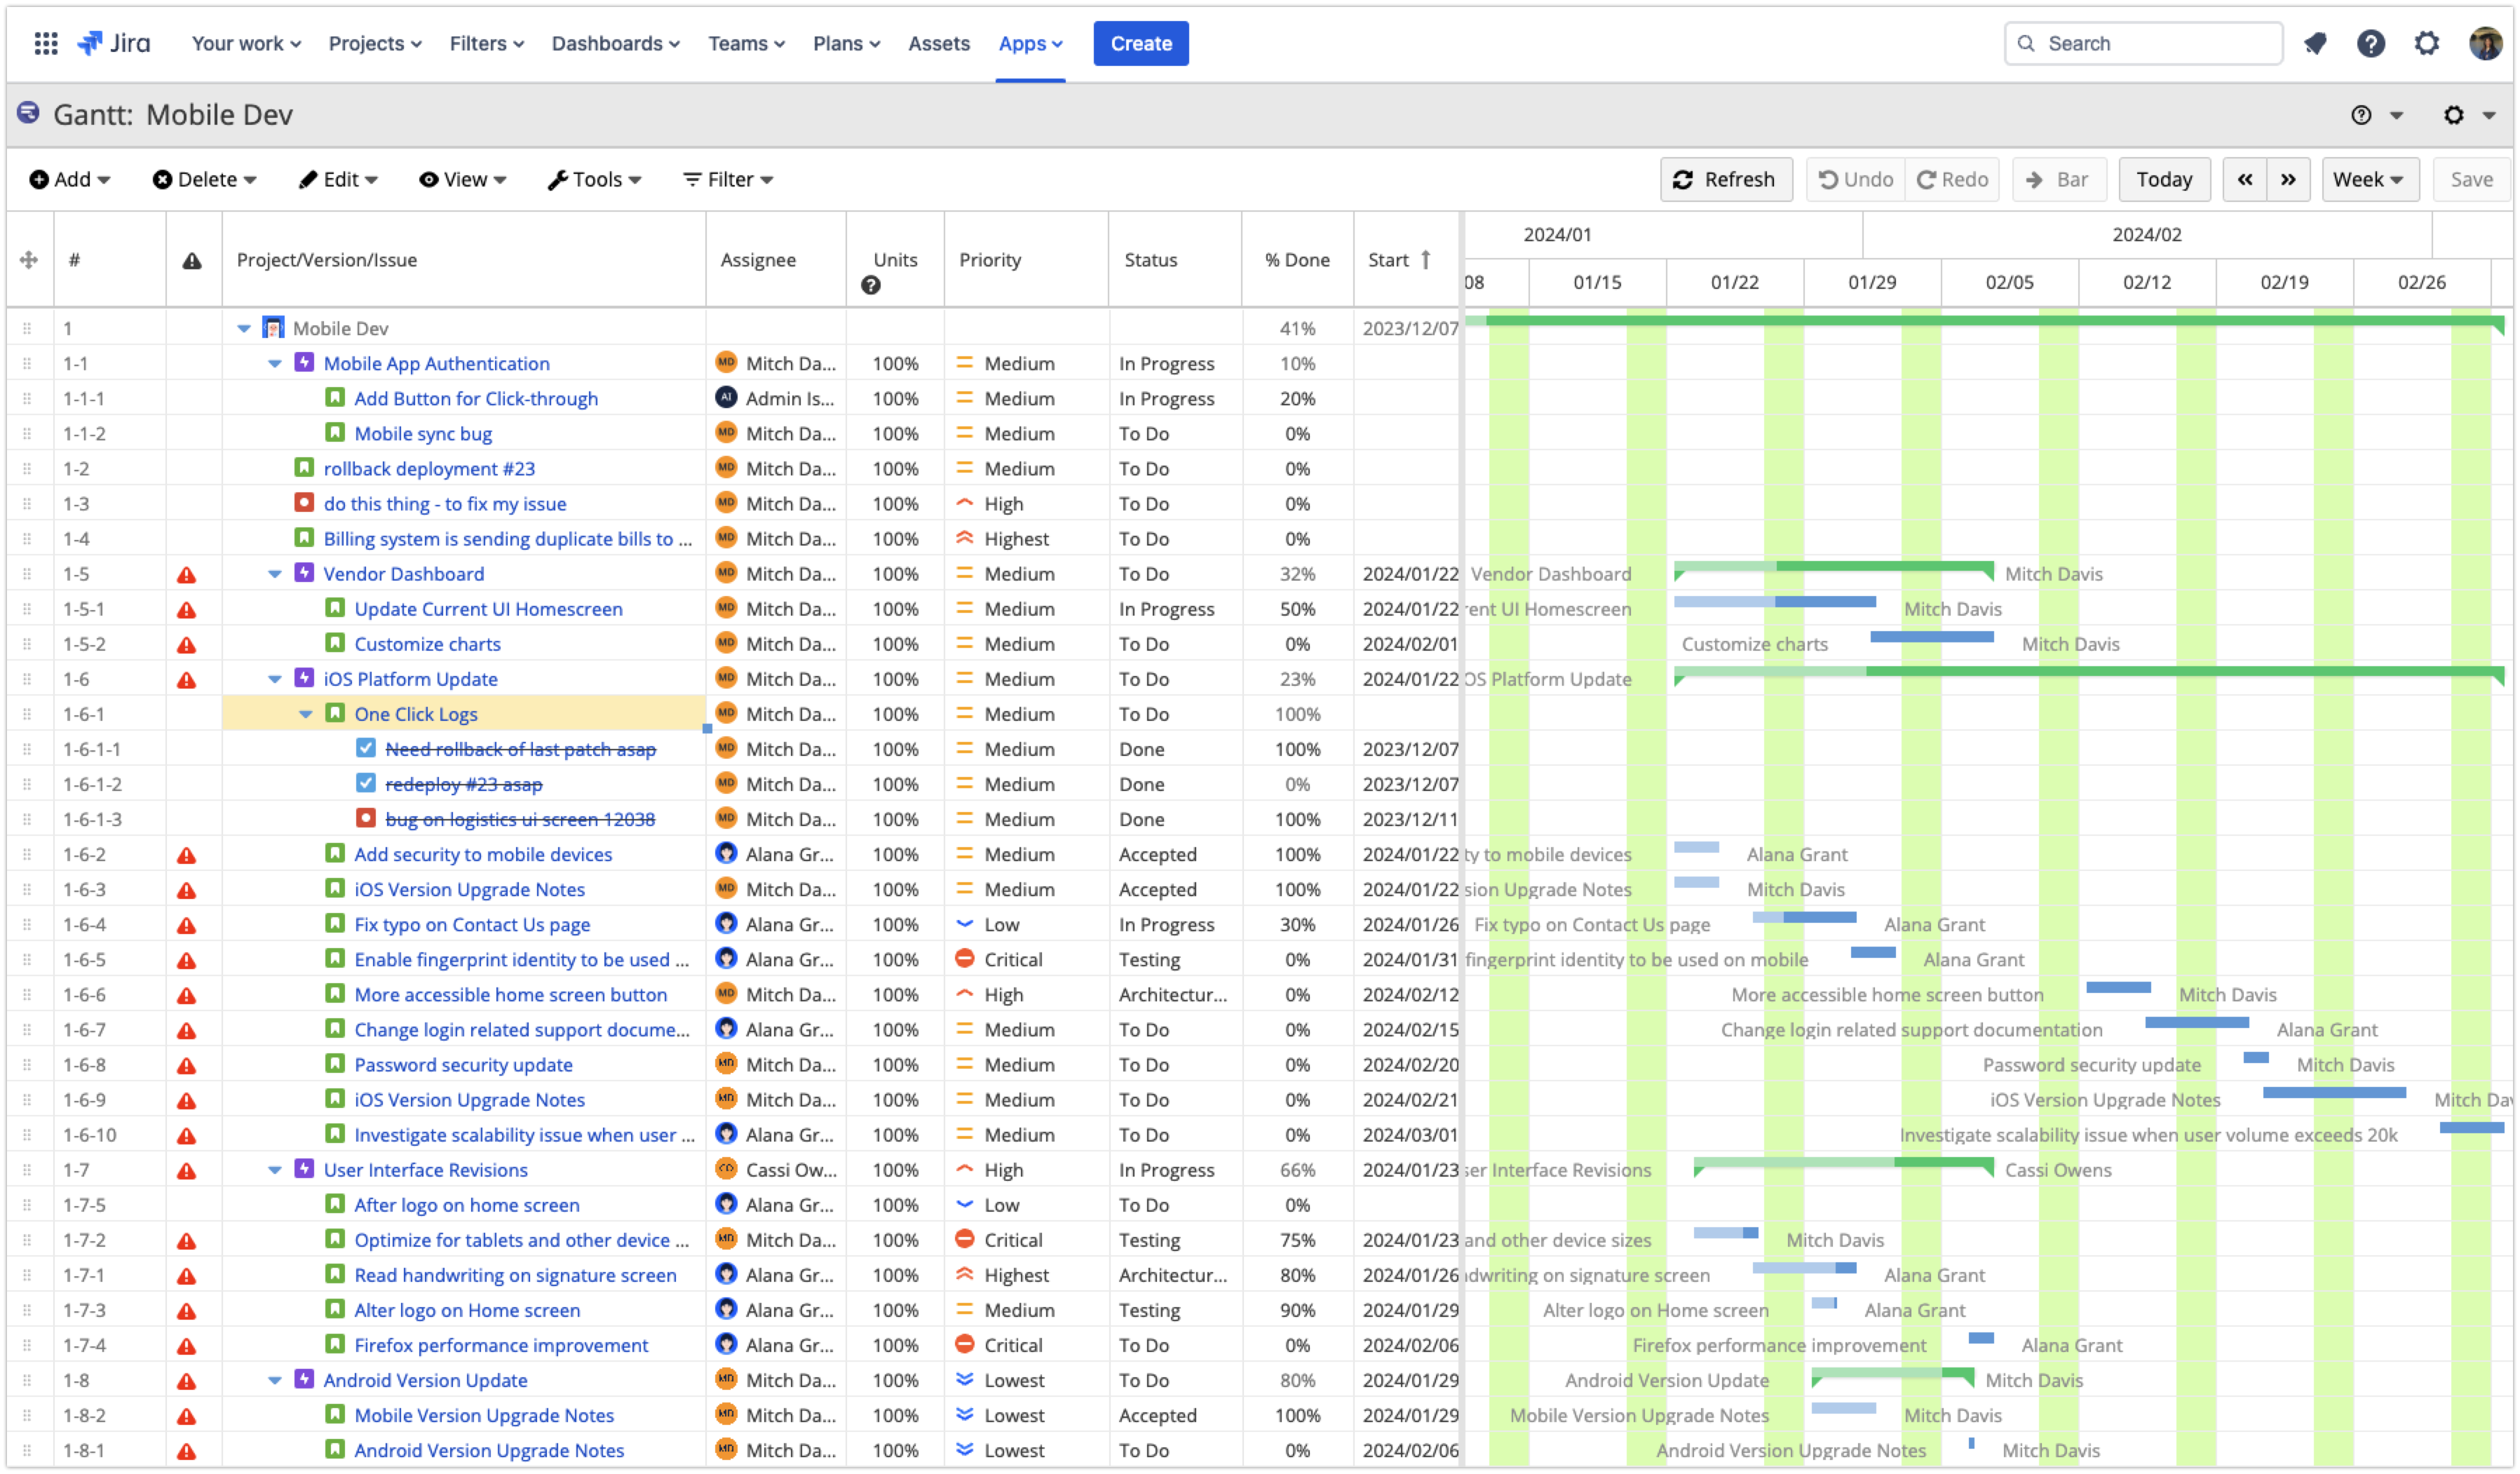
Unlike the strict issue hierarchy levels in Jira, with this app, you can also establish parent-child relationships among tasks of the same issue type, allowing for an unlimited hierarchical structure.
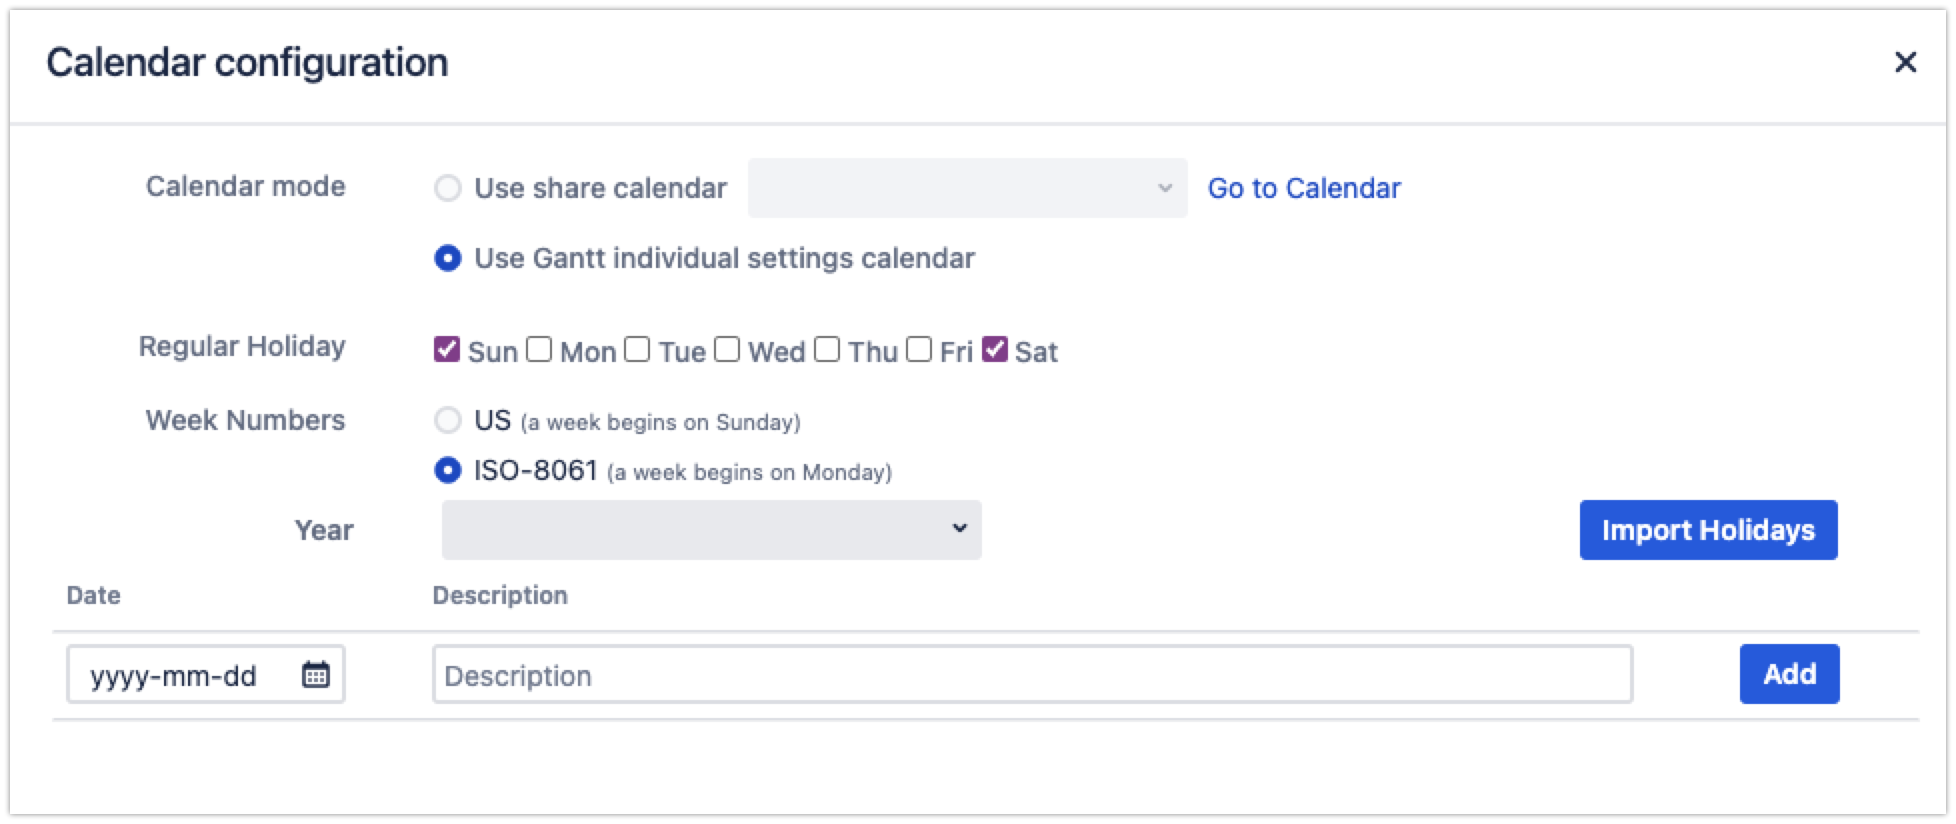
Once you’ve created the Gantt view, you can flexibly configure it to reflect your actual project environment. For instance, you can edit the working calendar by importing Holidays or define the timeline by fiscal year.
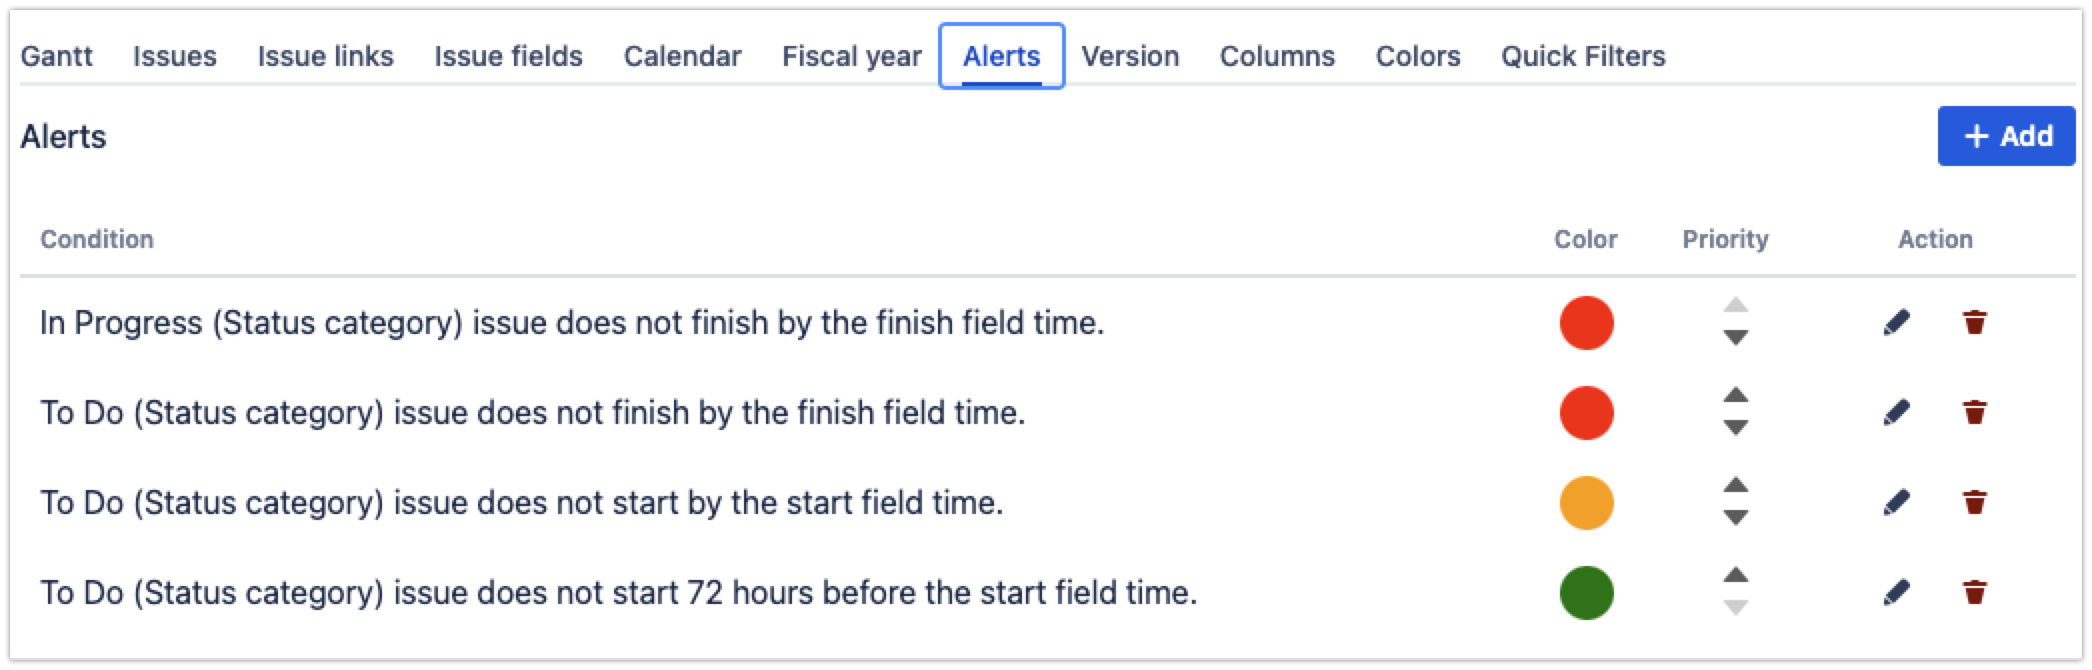
Need more visual indicators of different priorities and progress bars? You can define these color settings based on your preferences.
If you work on a complex Gantt project plan, you’ll enjoy the quick filters setting! It works just like quick filters on your Jira board. Using JQL, you can search for issues and save the filter to display different collections of issues on Gantt.
A project can turn into chaos without a clear work structure and a logical timeline for sequential tasks. This is where WBS Gantt-Chart app can save your project from downfalls. It allows you to automate a large chunk of your project scheduling with an intuitive drag-and-drop interface.
Here’s how it works:
As the project takes shape, it’s time to estimate team capacity and start distributing the work. Ideally, you would want to assign resources to each issue based on everyone’s current and future availability.
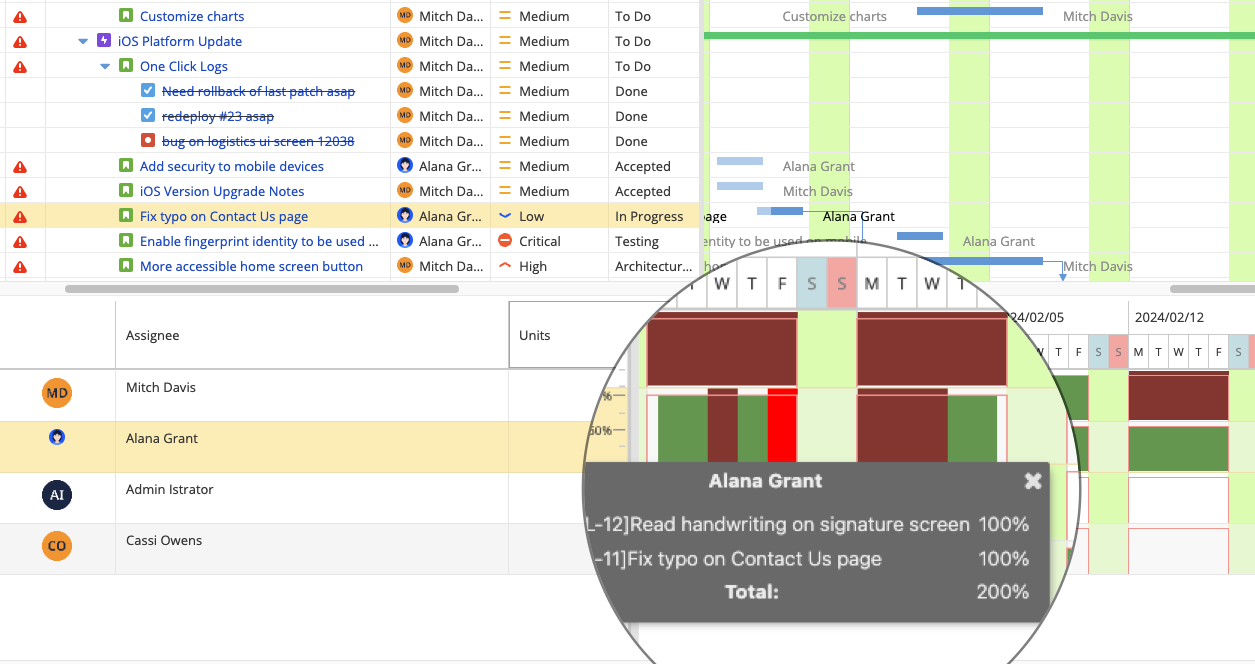
WBS Gantt-Chart’s resource planning tool allows you to simultaneously view an individual’s workload, presented as “Units,” and finetune the work contour on the Gantt chart.
If anyone is assigned an excessive amount of work, the bar in the chart turns red to alert you of this. You can use the app to efficiently allocate resources to issues for optimal and shortest project planning.
Related: How to Use Gantt Chart for Project Planning
The critical phase of project management begins at the end of your project planning. Remember to save the Gantt you’ve just created as a Baseline to track your project progress against the original plan.
You can enable Baseline tracking from the Tools dropdown menu. Now you’ll see light gray colored bars underneath your tasks showing the Baseline Plan. This makes it easy to track whether you’re ahead or behind schedule. It’s possible to change the color of the Baseline for better visibility.
On top of that, as a project manager, you must be aware of the potential bottlenecks that may affect the project deliverables. Pay attention to the project’s critical paths, highlighted in red, to prioritize tasks accordingly.
That’s it! You have mastered next-level project management with WBS Gantt-Chart for Jira. Try it today for free.
If you have any problems implementing Gantt charts, drop us a message!