Knowledge Space
When drafting out the plan, you can take advantage of Atlassian Intelligence for quick idea generation and more.
Master the four phases of project management with Atlassian apps.
Project management is complicated. You have to juggle between teams to plan, coordinate the execution of project work, and monitor overall performance. Things can get messy: overcommitted team members, conflicting workflows, siloed information, or worse, budget overrun. All these problems can easily sink your project.
Furthermore, you need to mold the team’s workflows & processes according to specific needs while ensuring smooth collaboration within the same platform. Adding numerous frameworks and methodologies into the mix is not an easy task without an adaptive project management tool.
That’s why Atlassian products are the top choice for teams seeking efficiency in project management. Tools like Jira and Confluence perfectly blend together to get you on the fast track to project success. From task management to collaborative content creation, teams can now master the intricacies of project management effectively.
In this guide, we help you navigate Jira and Confluence along with a hand-picked selection of top-rated Marketplace apps for successful projects.
Any dish is created from a recipe. Likewise, project planning doesn’t start until you identify the scope of work. You’d want to get buy-in with a clear business case and the delivery timeline, among other details. You can capture the entire project plan inside Confluence and keep all stakeholders on the same page.
There are many ingredients that go into creating the statements of work. Most importantly, you need to define the project goals, the deliverables or work that must be done to accomplish them, and the team responsible for carrying out the plan.
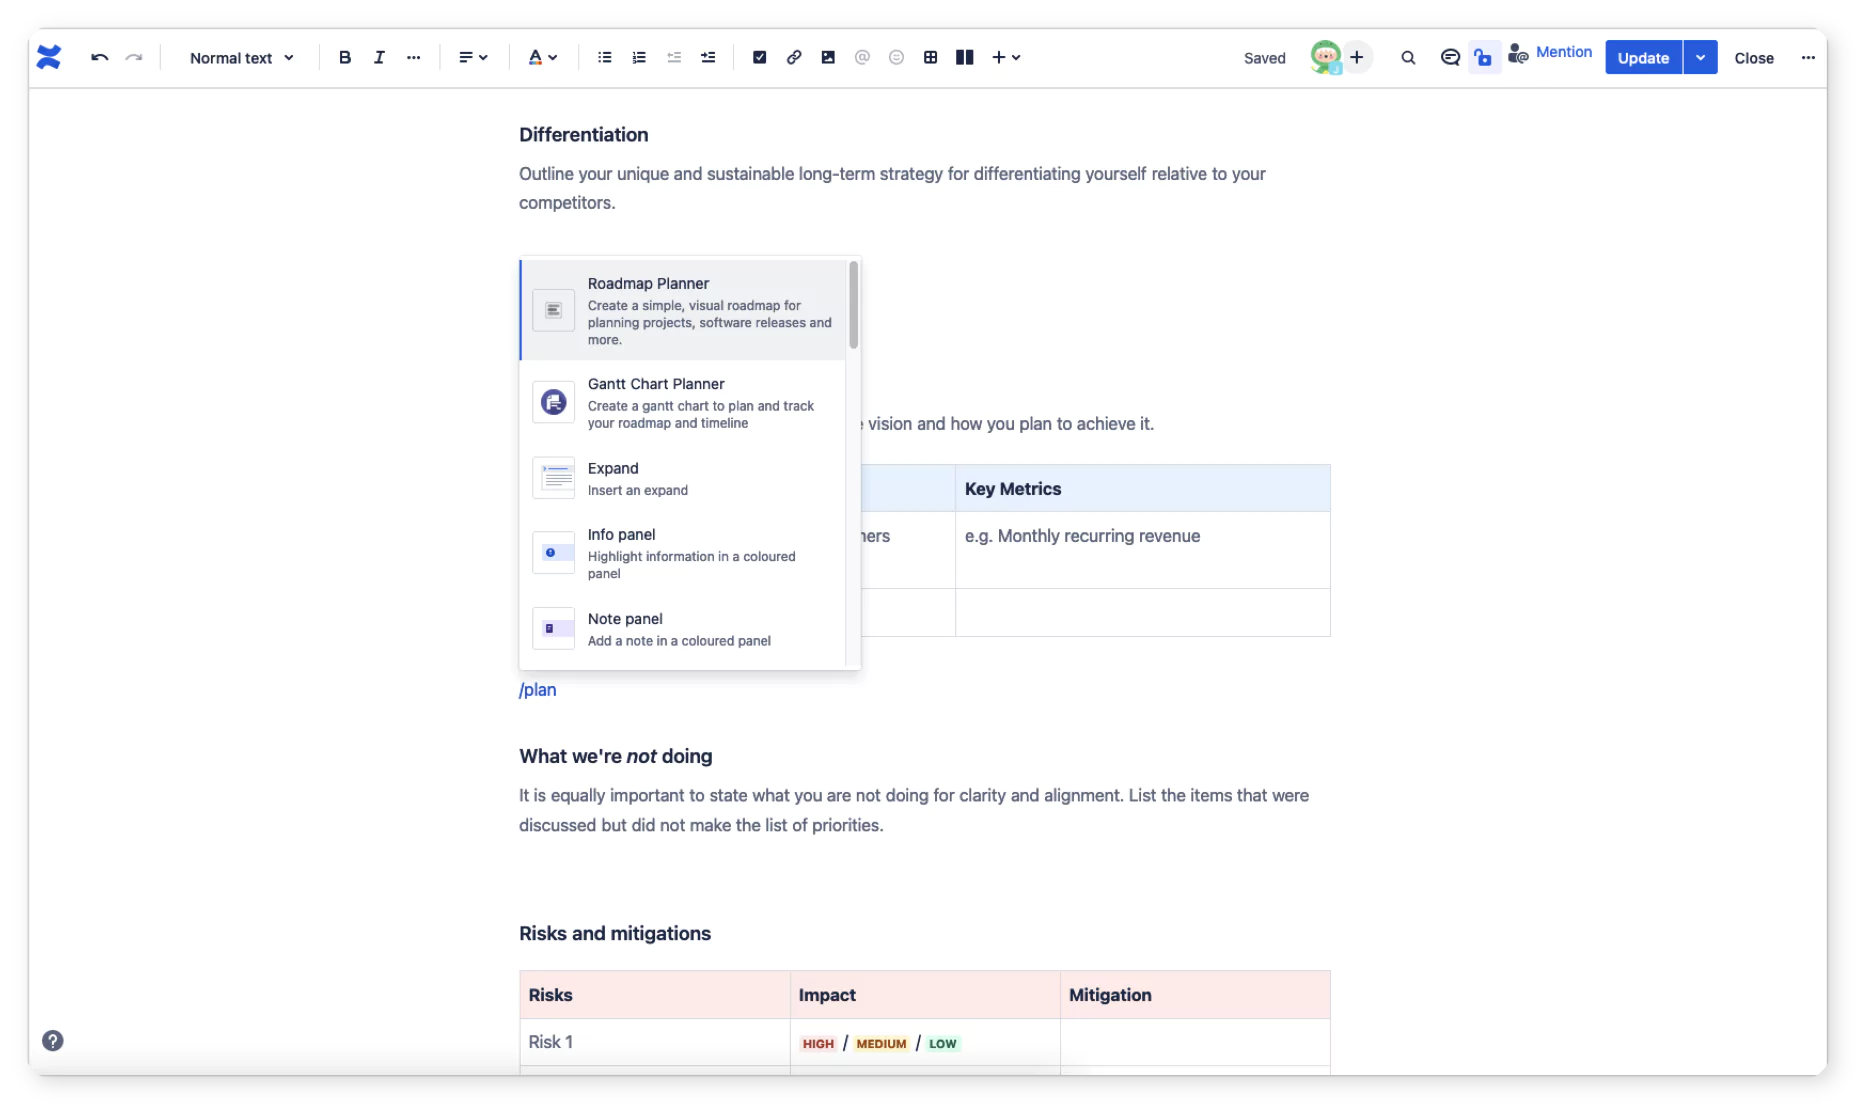
Using Confluence templates, you can quickly visualize and share a project plan with stakeholders, including a holistic view of project goals, timelines, and key performance indicators.
When drafting out the plan, you can take advantage of Atlassian Intelligence for quick idea generation and more.

Juice up your Confluence project plan with macros – visual elements on the page like tables, sections, and even Jira tasks – to ensure the content is engaging and easily digestible.
Learn more about how you can visualize and plan a project with Gantt Chart Planner macro below.
Your Confluence page serves as a blueprint, guiding teams through the intricacies of project kick-off. Therefore, you’d want to define goals and organize tasks around each milestone. Remember, various stakeholders will be reviewing this document, so you need to ensure the information is presented in a way that suits different audiences.
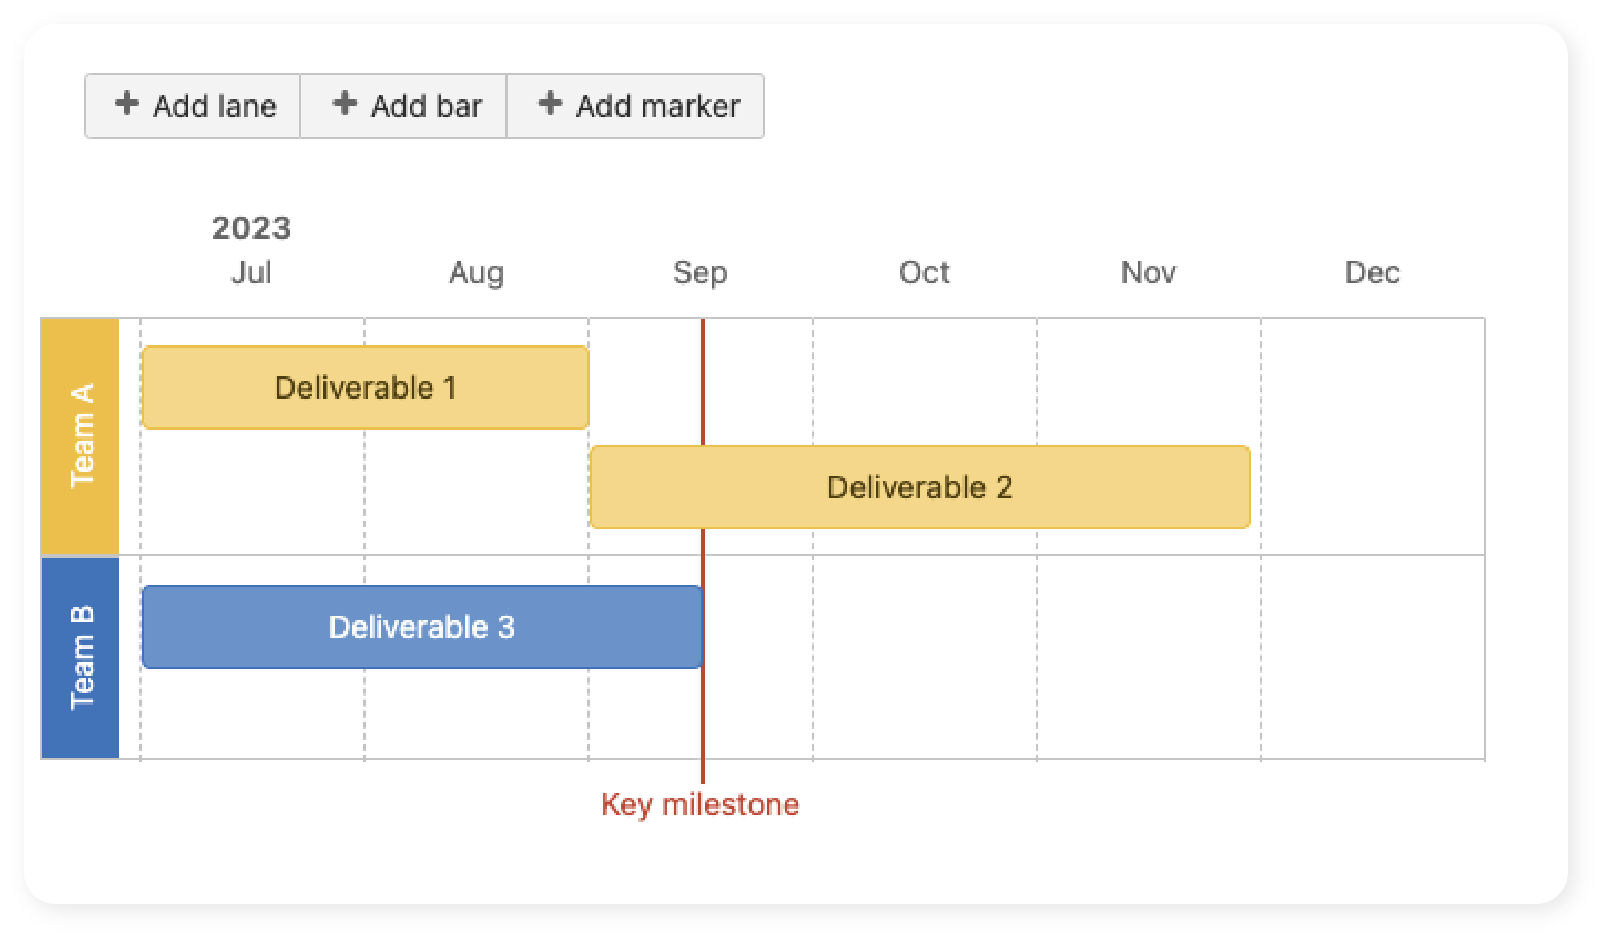
One of the must-have elements of a project plan is the delivery roadmap:
The roadmap macro gives you a simplified view of the project milestones on a timeline. You can break down the major tasks in swimlanes with each bar representing the duration of those tasks.

Need to map dependencies for better task planning and scheduling? Or maybe allocate resources based on actual team capacity? You can achieve all this with the Gantt Chart Planner app – one of our flagship project management solutions for Confluence.
The best part is, that you can convert the tasks on the Gantt Chart into Jira tasks as well, just like the native Confluence feature!
Expand the (+) markers to learn about the apps in the diagram.

Now, you can keep your stakeholders aligned on the project plan, from a high-level overview to individual tasks, along with the expected delivery dates in real time. It’s extremely helpful for reviewing your team’s progress across Jira and Confluence.
Now, you’re ready to set things in motion!
Confluence’s integration with Jira ensures that project-related content is seamlessly connected to tasks and workflows. Let’s begin assembling the tasks in Jira!
You’ll enjoy its flexibility and adaptability for any team, especially in response to changing project requirements. To implement Jira for project management, there are a few key concepts that will help you navigate the tool more easily.
Jira’s timeline (roadmap) feature is great for high-level Epic planning. It enables you to group related tasks by sprints or releases. However, you can only visualize epic-to-story hierarchical levels and dependencies between epics. It lacks a granular view of related children issues and their relationships, making it difficult to catch potential blockers.
But there’s a workaround.
Professional project managers often use the Work Breakdown Structure (WBS) technique to plan project work. It’s essentially a list of tasks your team needs to complete the project, organized in a hierarchical order, which is a missing view in Jira board and backlog. With WBS Gantt-chart for Jira, you can draw the relationships between tasks and execute them accordingly.
You can easily break down tasks and organize the entire project based on “version” or “sprint,” depending on how your project is structured. Not only that, it allows you to manage team capacity and see the relationships between tasks across the timeline.
Planning tasks is seamless with the drag-and-drop feature – you can flexibly adjust the task duration and see how it impacts your project. The updated task data (duration, status, etc.) will get synced in native Jira issue fields as well, so all project information remains consistent across platforms and tools.

Manage tasks in a hierarchical order with the work breakdown structure (WBS).
Drag-and-drop task relationships to visualize dependencies.
Allocate team resources according to capacity forecasts.
Expand the (+) markers to learn about the apps in the diagram.
Now that your project is well underway, keep the feedback coming to refine your project deliverables.
As they say, “sell the sizzle, not the steak.” The completion phase doesn’t mean signed – sealed – delivered and it’s done. Testing is a major part of a project life cycle to ensure that the project fulfills the defined business outcomes, especially for iterative software development projects.
Throughout the phases of your projects, it’s important to keep track of the status of tasks, identify bottlenecks, and celebrate milestones.
WBS Gantt chart not only enables teams to collaborate at ease, but it also helps you gain better control over the project performance.
With the critical path feature, you can ensure teams focus on tasks directly impacting the project’s duration. Knowing the critical path allows you to allocate resources strategically. For instance, to dedicate resources to critical tasks to ensure they are completed efficiently and on time.
In the next step, you can utilize Jira dashboards for stakeholder reporting. As an admin, you can build a Jira dashboard with diverse tools to monitor project health. From burndown charts displaying task completion rates to velocity charts, these gadgets provide invaluable insights at a glance.
In general, Jira offers the following report types that can be useful for your projects:
Finally, your project is ready for delivery! You’ve gained a unified approach to project success using the combined power of Jira, Confluence, and Marketplace apps.

Not quite. It’s time to reflect on what went well, what didn’t, and how you can deliver better outcomes. Once you ship the MVP, anticipate customer feedback to define the next project scope.
These tips and tools aim to help you make the most of Jira and Confluence for your project management practices. Learn more about the featured Marketplace apps from the eBook: The Project Manager’s Guide to Atlassian Apps.